Evaluative study for visual stimuli creation, Rutgers University – Newark, Psychology department
Background and Goals
The Memory and Computational Cognition and the Stress Psychophysiology & Affective Neuroscience labs need a novel set of visual stimuli (i.e. images) to implement in experiments featuring emotion studies. The stimuli must be rated by users on dimensions of negative and positive valence, threat, loneliness, and sociality (social information). These ratings will allow the department to create a standardized image set, so that there is consistency across the labs when researching the effects of emotional visual stimuli on various psychological factors (i.e. emotion and memory , emotion and stress). Some key goals we have:
Evaluative research goals:
- Evaluate users’ perceptions of what constitutes as negative, positive, and social content.
- Based on user feedback, generate a series of isolated and scenic images and gather ratings on various dimensions.
- Create a set of visual stimuli that will allow researchers to evaluate emotional responses from users.
Method
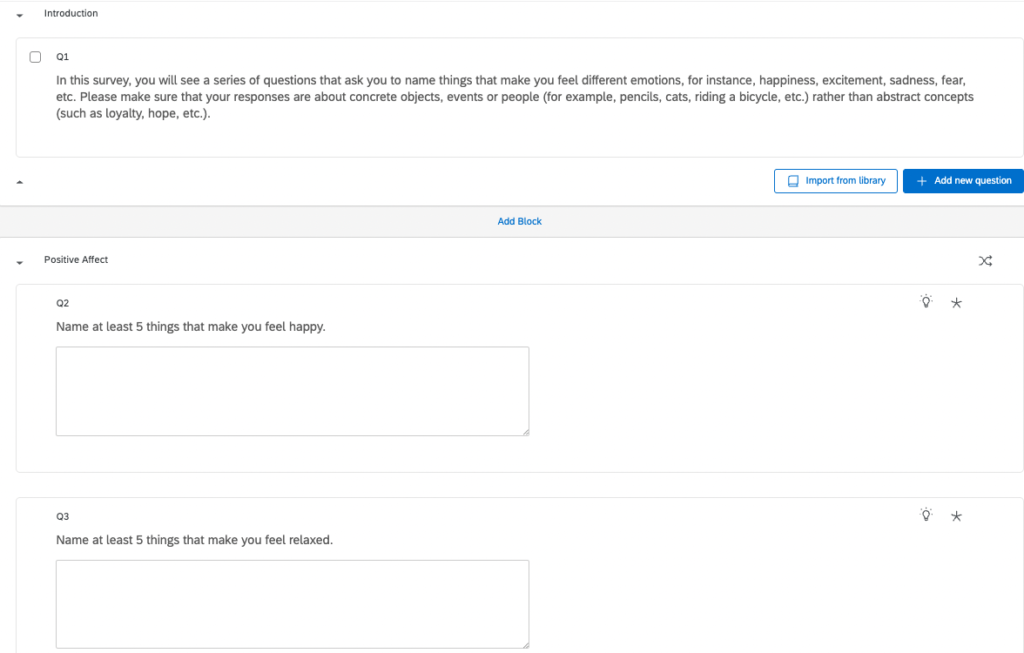
Using Qualtrics, we gathered qualitative data from 232 users on what they regarded as:
- positive (e.g. what makes you happy?)
- negative (e.g. what makes you upset?)
- threatening (e.g. what would you stay away from?)
- lonely (e.g. what do you associate with loneliness?)
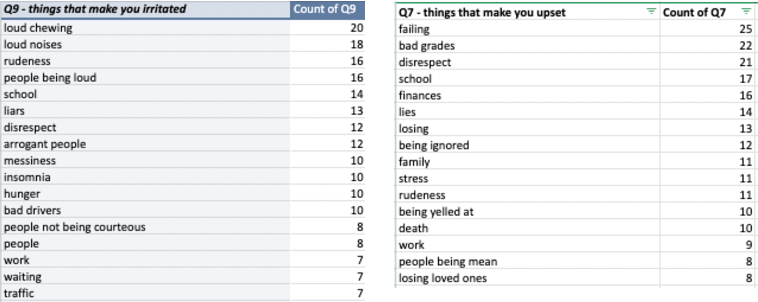
We then coded the data into categories, organizing them in chunks of responses that were most to least popular.
Data indicated commonalities in responses (e.g. happy = friends and family, irritated = loud chewing and noises, upset = failing and bad grades).
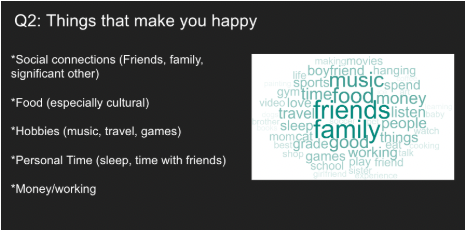
Wordmap of users’ perception of “happy”
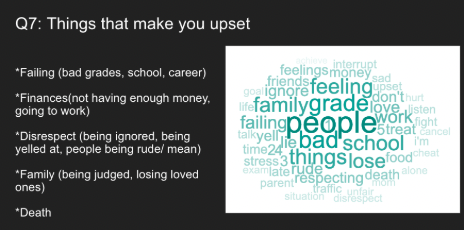
Wordmap of users’ perception of “upset”
Based on the most popular responses, I gathered up to 200 scenic backgrounds and over 100 isolated images depicting a variety of positive scenes (e.g. a group of friends) and negative scenes (e.g. a violent interaction). I then gathered ratings of these newly acquired images on Qualtrics.

Examples of images (items and backgrounds) viewed and rated by participants.
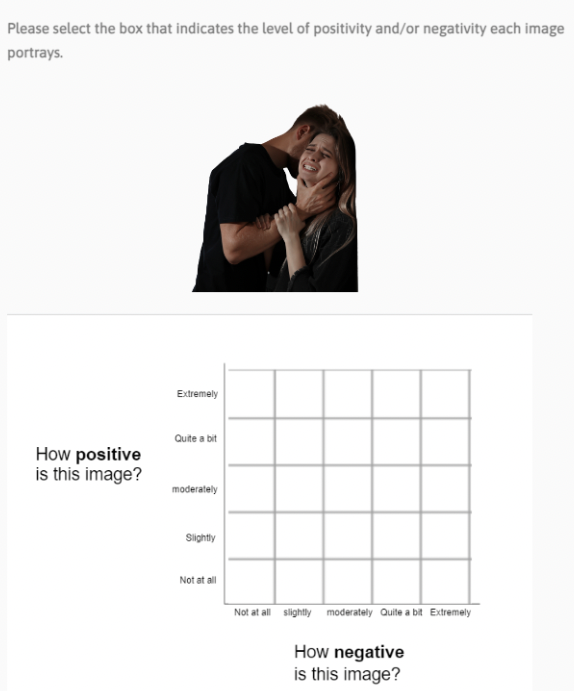
Using the Emotional Evaluative Space Grid, users indicated how “negative” and “positive” each image was.
This methodology utilized dimension analysis, a form of affinity mapping where you use a line (also called a dimension) to plot users on a continuum (e.g. valence: less positive —> more positive). We wanted to know how well the users perceived the different images, and plotting them on a continuum helped us see their different levels of understanding in relation to one another.
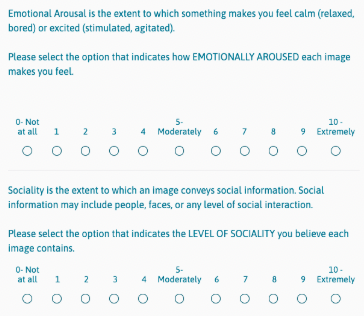
Users additionally rated each image on its level of arousal and sociality (social information).
From these responses, I selected images that best conveyed positive, negative, and social affect based on the Principal Investigator’s pre-determined criteria. These images were then included in the image database for the two labs.
Research Impact
- Novel stimuli creation backed by user selection and research insights allowed labs to access internal departmental images.
- Through cross-functional collaboration, several labs were able to gather feedback from a diverse population and incorporate it to the ratings.
- Stimuli design and visual components are currently being reused in new studies this year.
My Learnings
- Early participant feedback plays an integral role in understanding the impact of emotional visual content, as there is often mismatch in how people perceive different scenes.
- Consistently gathering images and getting ratings from new sources allows for course correction when the dimensions of a rating for one image are unclear or inconsistent.
- Thorough testing allows for a stimuli set with ratings that have high levels of reliability, which is integral to getting accurate information during a psychological experiment.
